| Email: info@psq.co.za Phone: 021 557 2491 Subscribe to our Newsletters |
| |
| Newsletter |
Are you Hampered with Continual SKU Shortages,
(but your car always has fuel)?
by Ken Titmuss
Here is why!
What if we had continuous visibility of all our SKUs, could this assist us in never stocking out? Is this possible?
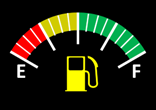
The Buffer, like the ‘Fuel Gauge’ has three zones:
Get in touch.
For more information, contact KenTitmuss.
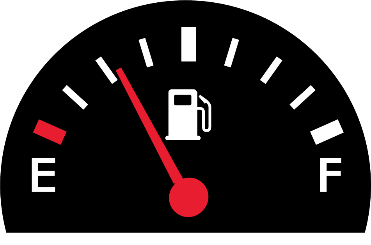
Why do we never run out of fuel in our car, but are continually short of Raw Materials, Components and Finished Products in our business? The answer is continuous visibility! |
 |
What if we had continuous visibility of all our SKUs, could this assist us in never stocking out? Is this possible?
 |
Absolutely! The Demand Driven MRP Methodology makes this happen - daily. |
Let’s see how our ‘Fuel Gauge’ analogy works.
With the gauge in the Green Zone, we are happy that the car will take us on our normal daily trips. When the gauge is in the Yellow Zone, we are still OK, but if we are planning a weekend away, we might want to fill up to ensure we have enough fuel for the trip. If the gauge is in the Red Zone, then definitely we have a priority to fill up reasonably urgently. So, this visibility of our stock level helps us decide our priority and the action required with regards to the replenishment of this vital raw material.
So, how could we translate this into the replenishment of the inventory levels for your Raw Materials, Components and Finished Goods?
Well, let’s create a ‘Fuel Gauge’ for a SKU. We will use your current SKU’s Daily Usage, Lead Time to replenish, any Minimum Order Quantities (MOQs) and Demand Variability (Coefficient of Variability) to size the buffer. The beauty of the system is that, on an ongoing basis, if any of these parameters change, the ‘Fuel Gauge’, which we will call the Buffer, automatically adjusts and right-sizes to the current environment.
The Buffer, like the ‘Fuel Gauge’ has three zones:
- The Green Zone, which is basically the replenishment order size and indicate the replenishment order frequency based on the daily usage.
- The Yellow Zone in the heart of the demand coverage in the buffer and is calculated using the SKU’s Average Daily Usage (ADU) and the replenishment Lead Time.
- The Red Zone is the safety in the buffer and is there to
absorb variability in the supply chain. It is not like traditional
safety stock, doesn’t function in the same way, but is there to
be used when needed because of variability.
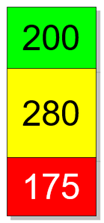 |
Let’s create a buffer for a SKU that currently has an ADU of 20, a Lead Time to replenish of 14 days and a MOQ of 200. The Green Zone will be the MOQ of 200. The Yellow Zone will be the Lead Time multiplied by the ADU, 14 x 20 = 280 The Red Zone will be calculated using a Lead Time and Variability factor, which can be determined, and in this case would give us a Red Zone of 175. |
So,
how do we use this buffer to determine when to send a replenishment
order to our supplier? We use a unique formula called the Net Flow (NF)
Calculation. The formula is:
Qualified Demand is orders due today, plus overdue orders, plus any known large demands in the future.
Let’s say in our situation we have an on-hand balance of 275, 200 on order but not yet received, and a qualified demand of 25. The Net Flow (NF) will be:
This will put the Net Flow in the Yellow Zone. Because the Net Flow is below the bottom of the Green Zone, we will receive a recommendation to order up to the Top of Green (TOG). In this example the order recommendation will be:
So we be advised to place an order for 205 to be delivered in 14 days’ time.
Now, what if you had a system that calculated the Net Flow daily for
all your, possibly thousands, of SKUs, and presented you daily with a
priority list of those SKUs that need replenishment? Would that
really assist you? Of course it would!
Demand Driven Africa is a channel partner of Demand Driven Technologies and their IntuiFlow suite of cloud/subscription-based DDMRP software, which does exactly what we have just demonstrated.
In addition, we are an affiliate of the Demand Driven Institute and offer their education and certification programmes for all aspects of the Demand Driven Adaptive Enterprise Model.
Contact us and let us show you that by setting up ‘Fuel Gauges’ for all your SKUs you can gain significant benefits such as improving your service levels, right sizing your inventory and, in some cases, reducing your lead times.
Net Flow = Current On-Hand + On Order – Qualified Demand
Qualified Demand is orders due today, plus overdue orders, plus any known large demands in the future.
Let’s say in our situation we have an on-hand balance of 275, 200 on order but not yet received, and a qualified demand of 25. The Net Flow (NF) will be:
275 + 200 – 25 = 450
This will put the Net Flow in the Yellow Zone. Because the Net Flow is below the bottom of the Green Zone, we will receive a recommendation to order up to the Top of Green (TOG). In this example the order recommendation will be:
TOG - NF
655 - 450 = 205
655 - 450 = 205
So we be advised to place an order for 205 to be delivered in 14 days’ time.
 |
Demand Driven Africa is a channel partner of Demand Driven Technologies and their IntuiFlow suite of cloud/subscription-based DDMRP software, which does exactly what we have just demonstrated.
In addition, we are an affiliate of the Demand Driven Institute and offer their education and certification programmes for all aspects of the Demand Driven Adaptive Enterprise Model.
Contact us and let us show you that by setting up ‘Fuel Gauges’ for all your SKUs you can gain significant benefits such as improving your service levels, right sizing your inventory and, in some cases, reducing your lead times.
Get in touch.
For more information, contact KenTitmuss.
About the Author
Ken has worked with with well over 200 companies, as a supply chain management consultant and providing their employees with education courses in Operations and Supply Chain Management. Ken has been involved with SAPICS for over 30 years, from running the Cape Town Chapter to being on the Board of Directors and holding the position of President twice. Ken is also an instructor for the APICS CPIM, CSCP and Instructor Development Programmes and the DDI DDP and DDL courses.
Ken has worked with with well over 200 companies, as a supply chain management consultant and providing their employees with education courses in Operations and Supply Chain Management. Ken has been involved with SAPICS for over 30 years, from running the Cape Town Chapter to being on the Board of Directors and holding the position of President twice. Ken is also an instructor for the APICS CPIM, CSCP and Instructor Development Programmes and the DDI DDP and DDL courses.